|
|
| Topics: |
|
|
|
|
|
|
|||||||||||||||||||||||||
|
|
|
|
|
I worked on upgrading some rigs to Ubuntu Linux, particularly version 18.04 since that was released since my last period of SETI participation when a couple of my computers were on 16.04. This has not gone all together smoothly since my experience with Linux is limited. You can read the full account here.
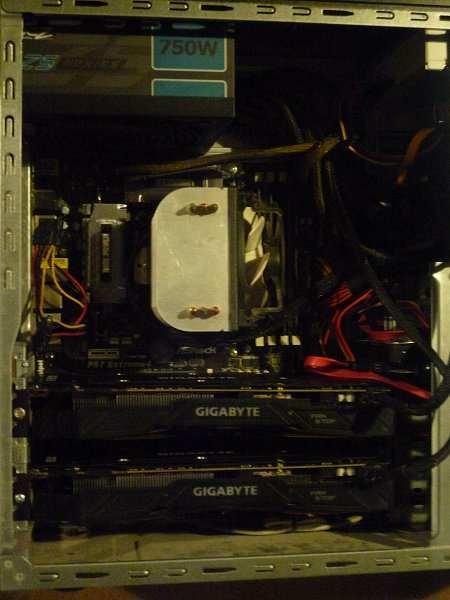
Since March 2018 I sold off a couple of the older graphics cards in my fleet, although one (a GTX 460) went kicking and screaming when it foresaw that it was about to be sold on ebay and failed literally 3 days before (it had worked faultlessly up until that point). The downside to replacing these older graphics cards is the lack of VGA/analog connections on the newer ones, meaning some of my screens are being made redundant. As far as leader boards go, I began this stint in 10th place in the UK. BOINCstats informed me that at my pre-upgrading-to-2x1070s status I am to (finally!) overtake the next person (who stopped participating) in around 70 days. However, there is someone behind me climbing rapidly up the rankings so I expect to only hold onto 9th spot for a short time before being overtaken and dropping back to 10th. It seems I’m destined to remain in this position, that is unless my recently upgraded fleet can get its head down and get my RAC (Recent Average Credit) up… at least two of my rigs still need upgrading to Ubuntu proper, and that would certainly help… |
|
|
|
|
I’ve been taking part in Earth Hour (and Earth Day) for most years now. The general idea is to stop using electricity for the hour. This can seem simple at first but once you start gearing up for it you realise just what things use and require electricity; lights, fridges, internet things, phones, watches, clocks… How this effects us will depend on our evening routines. How we can take part will typically depend on the people we live with.
Your can read my full blog post on the topic here: |
|
|
|
|
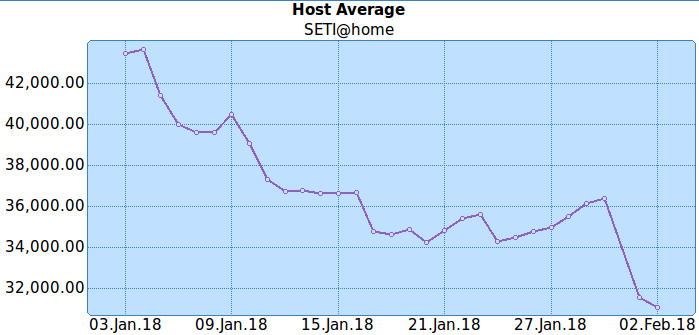
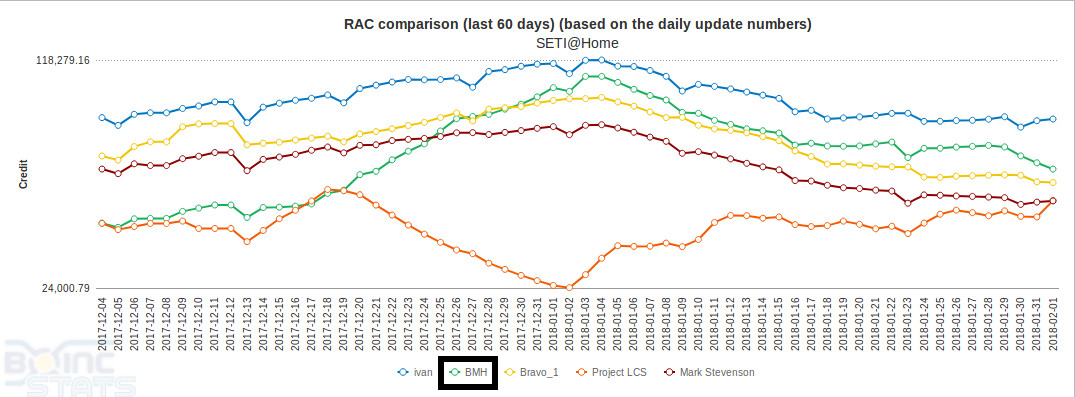
January was a quiet month for my SETI@home efforts, compared to last month, due to 1) nothing going wrong at my end, 2) the project not giving me a full quota of work, and 3) the credit for work being low. At the beginning of January I saw my best efforts for this SETIing period, as far as figures are concerned.
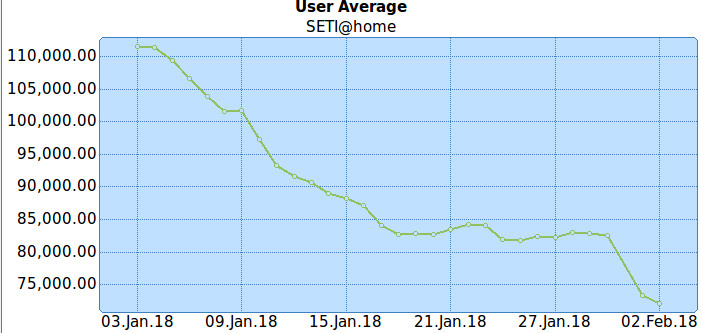
Point 3 above basically means that even if all my computers are on and working 24/7 from one week to the next, the credit for those weeks might vary, hence the plummeting graphs above. A good way to confirm this happening is to compare my efforts to others around me on the UK leader-board as per the graph below.
Since I monitor my week-by-week electricity usage I’ve calculated that my average usage for this SETI-season of mine (November-March) is higher than the last, so I’ve cut down this past week and hopefully I can rein in my average usage by the end of March, but I have no idea how chilly February might get. Another factor that has swayed my decision to cut down is because January has seen me (re)take 9th place and BOINCstats inform me that there are more days until my next overtake (of someone who no longer participates) compared than until the end of March when I power everything down proper. This is strikingly similar to how I ended up last year, but again it’s affected by point 3) since credit for work is low.
|
|
|
|
|
|
|
|
|
|
|